
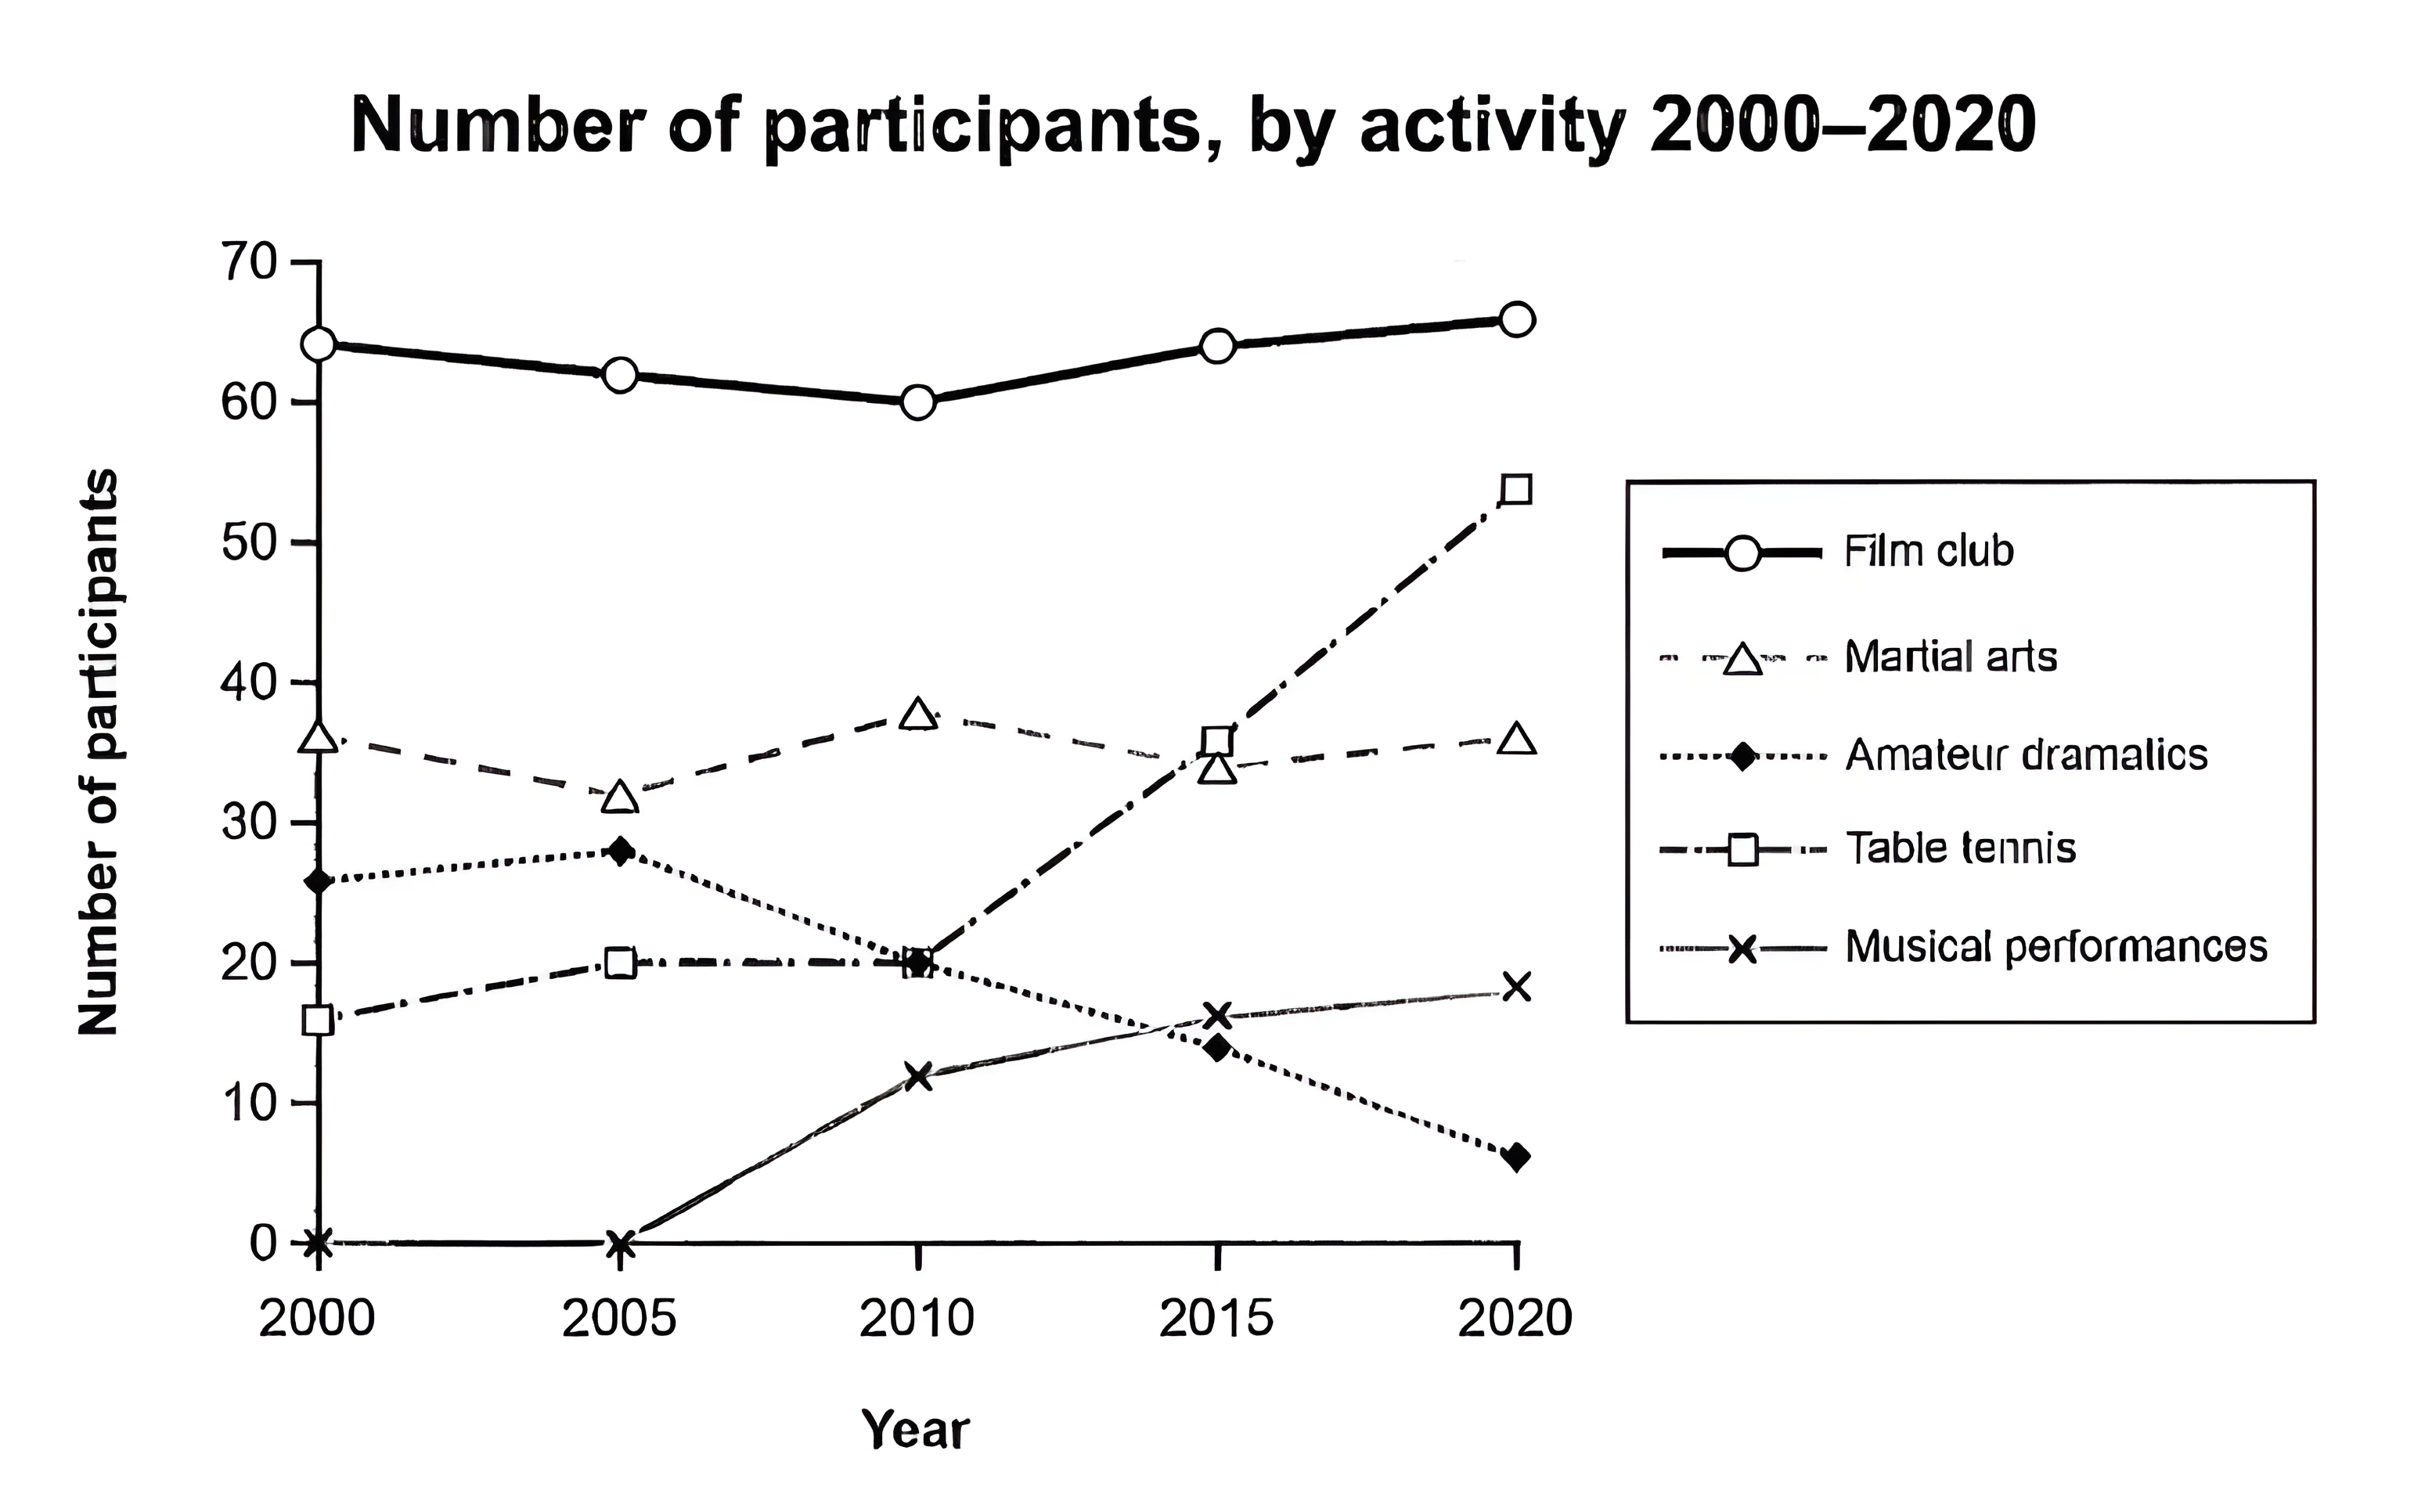
The graph below gives information on the numbers of participants for different activities at one social centre in Melbourne, Australia for the period 2000 to 2020.
Summarise the information by selecting and reporting the main features, and make comparisons where relevant.
Write at least 1 50 words.
我的答案
范文参考
练习推荐
Word Count: 0